Election Results
Covering results on election night can be a tricky thing. Data is available from multiple sources, in different formats, and often times with different update intervals.
I covered election results between 2013 and 2019. I quickly realized the need to automate collection and display of this data and wrote a set of tools I call ELX.
The first component to ELX is a backend tool that creates and manages a data model. This model is then updated from different scrapers. A final model is output by looking at the most up to date data available.
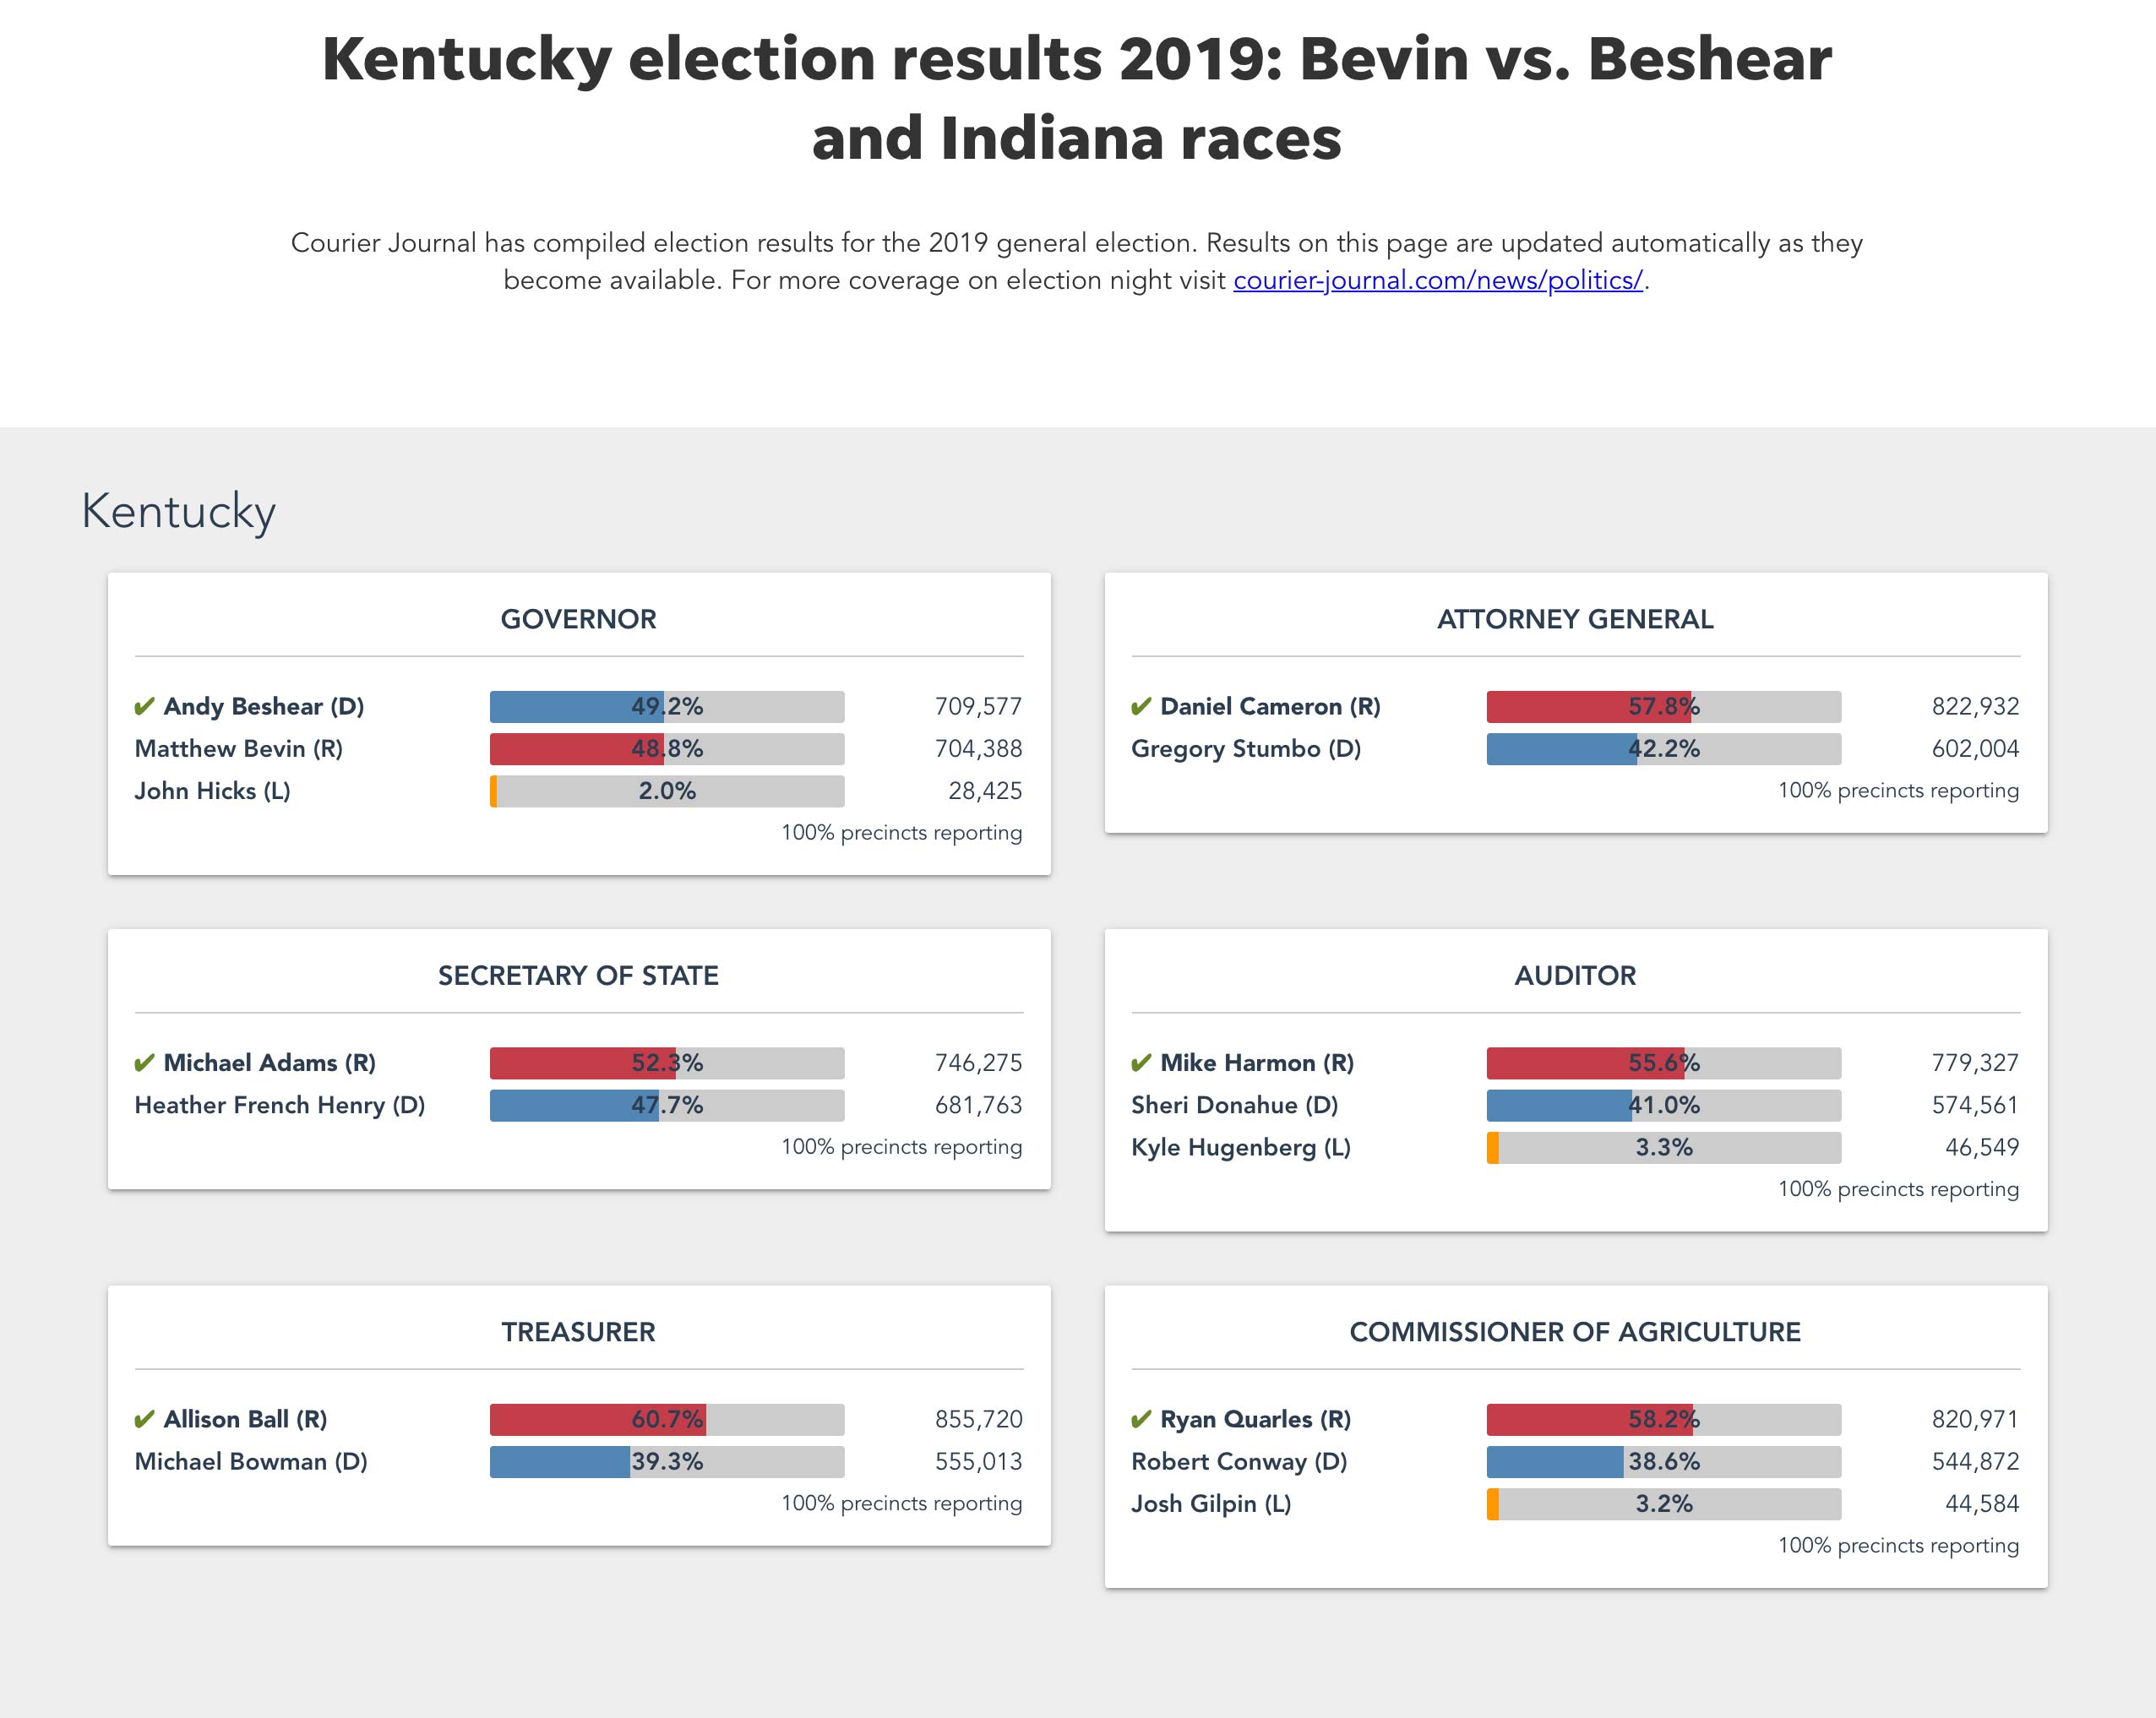
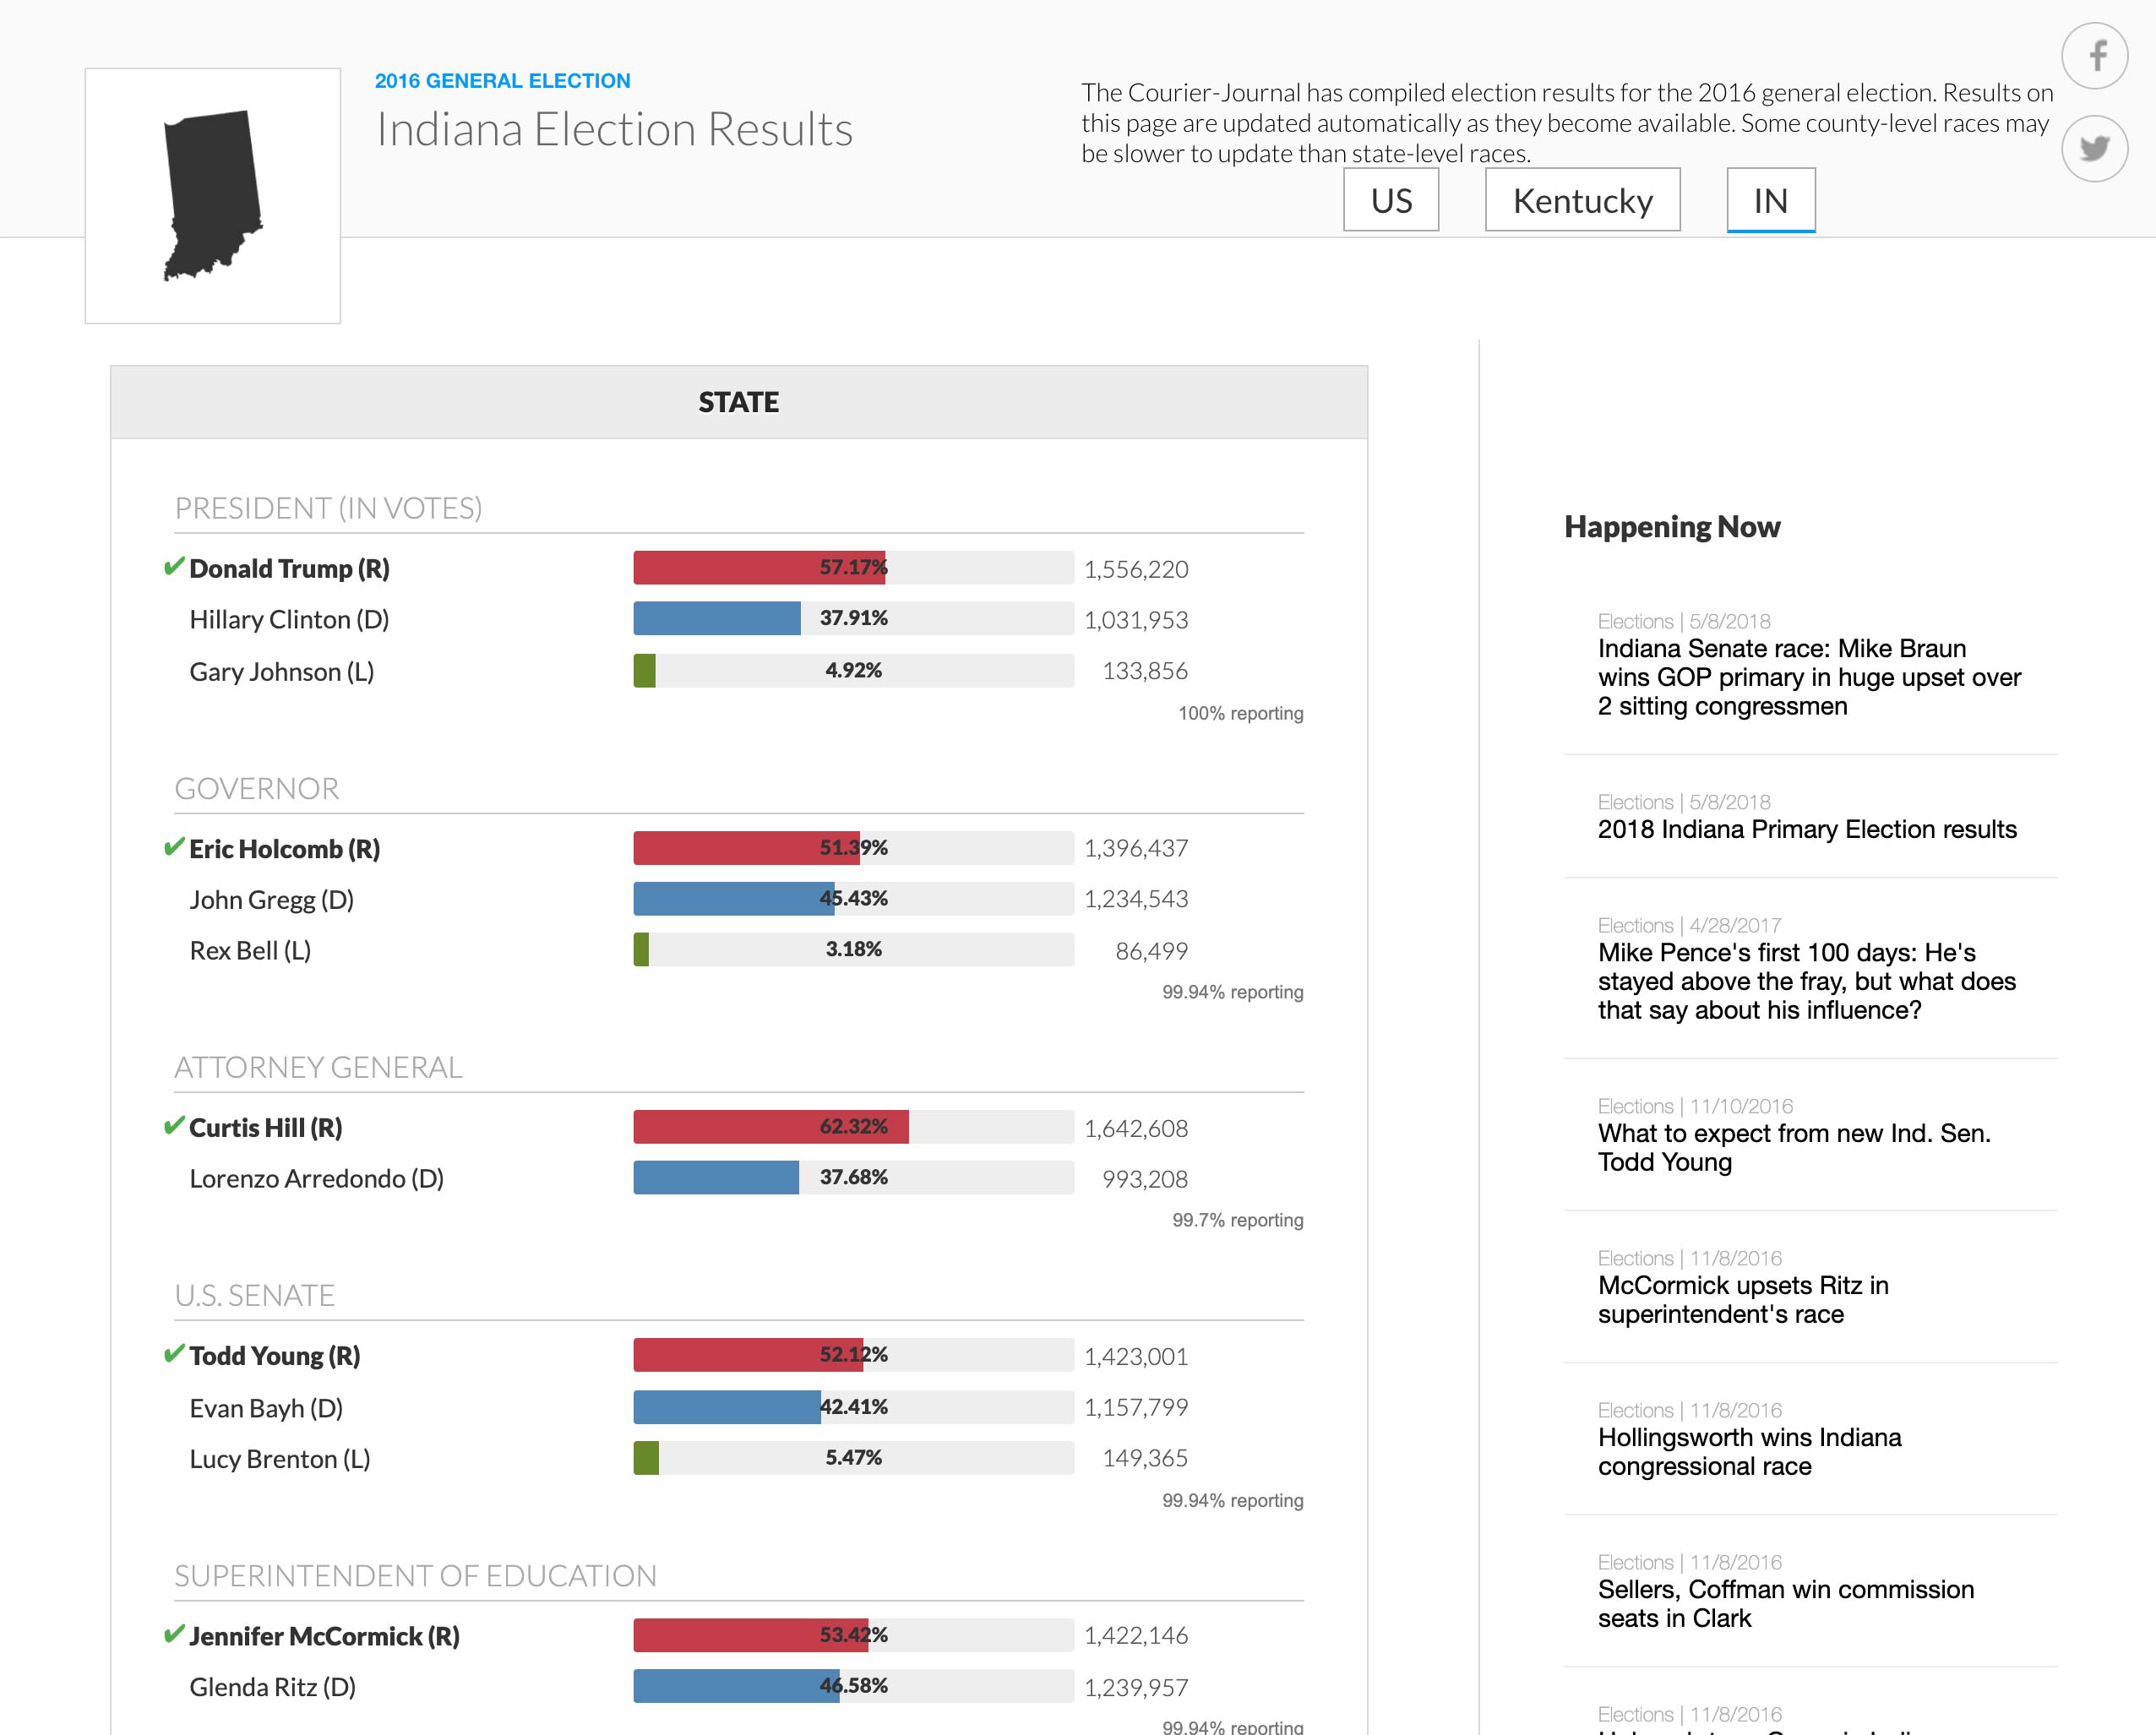
The second part of ELX is the frontend that users see. The interface constantly updates its number throughout the night and animations occur showing numbers counting up, bar charts slowing easing outwards, and the order of who’s currently ahead in a race smoothly transitioning into place.