Louisville Sewer Collapses
StandaloneMapping
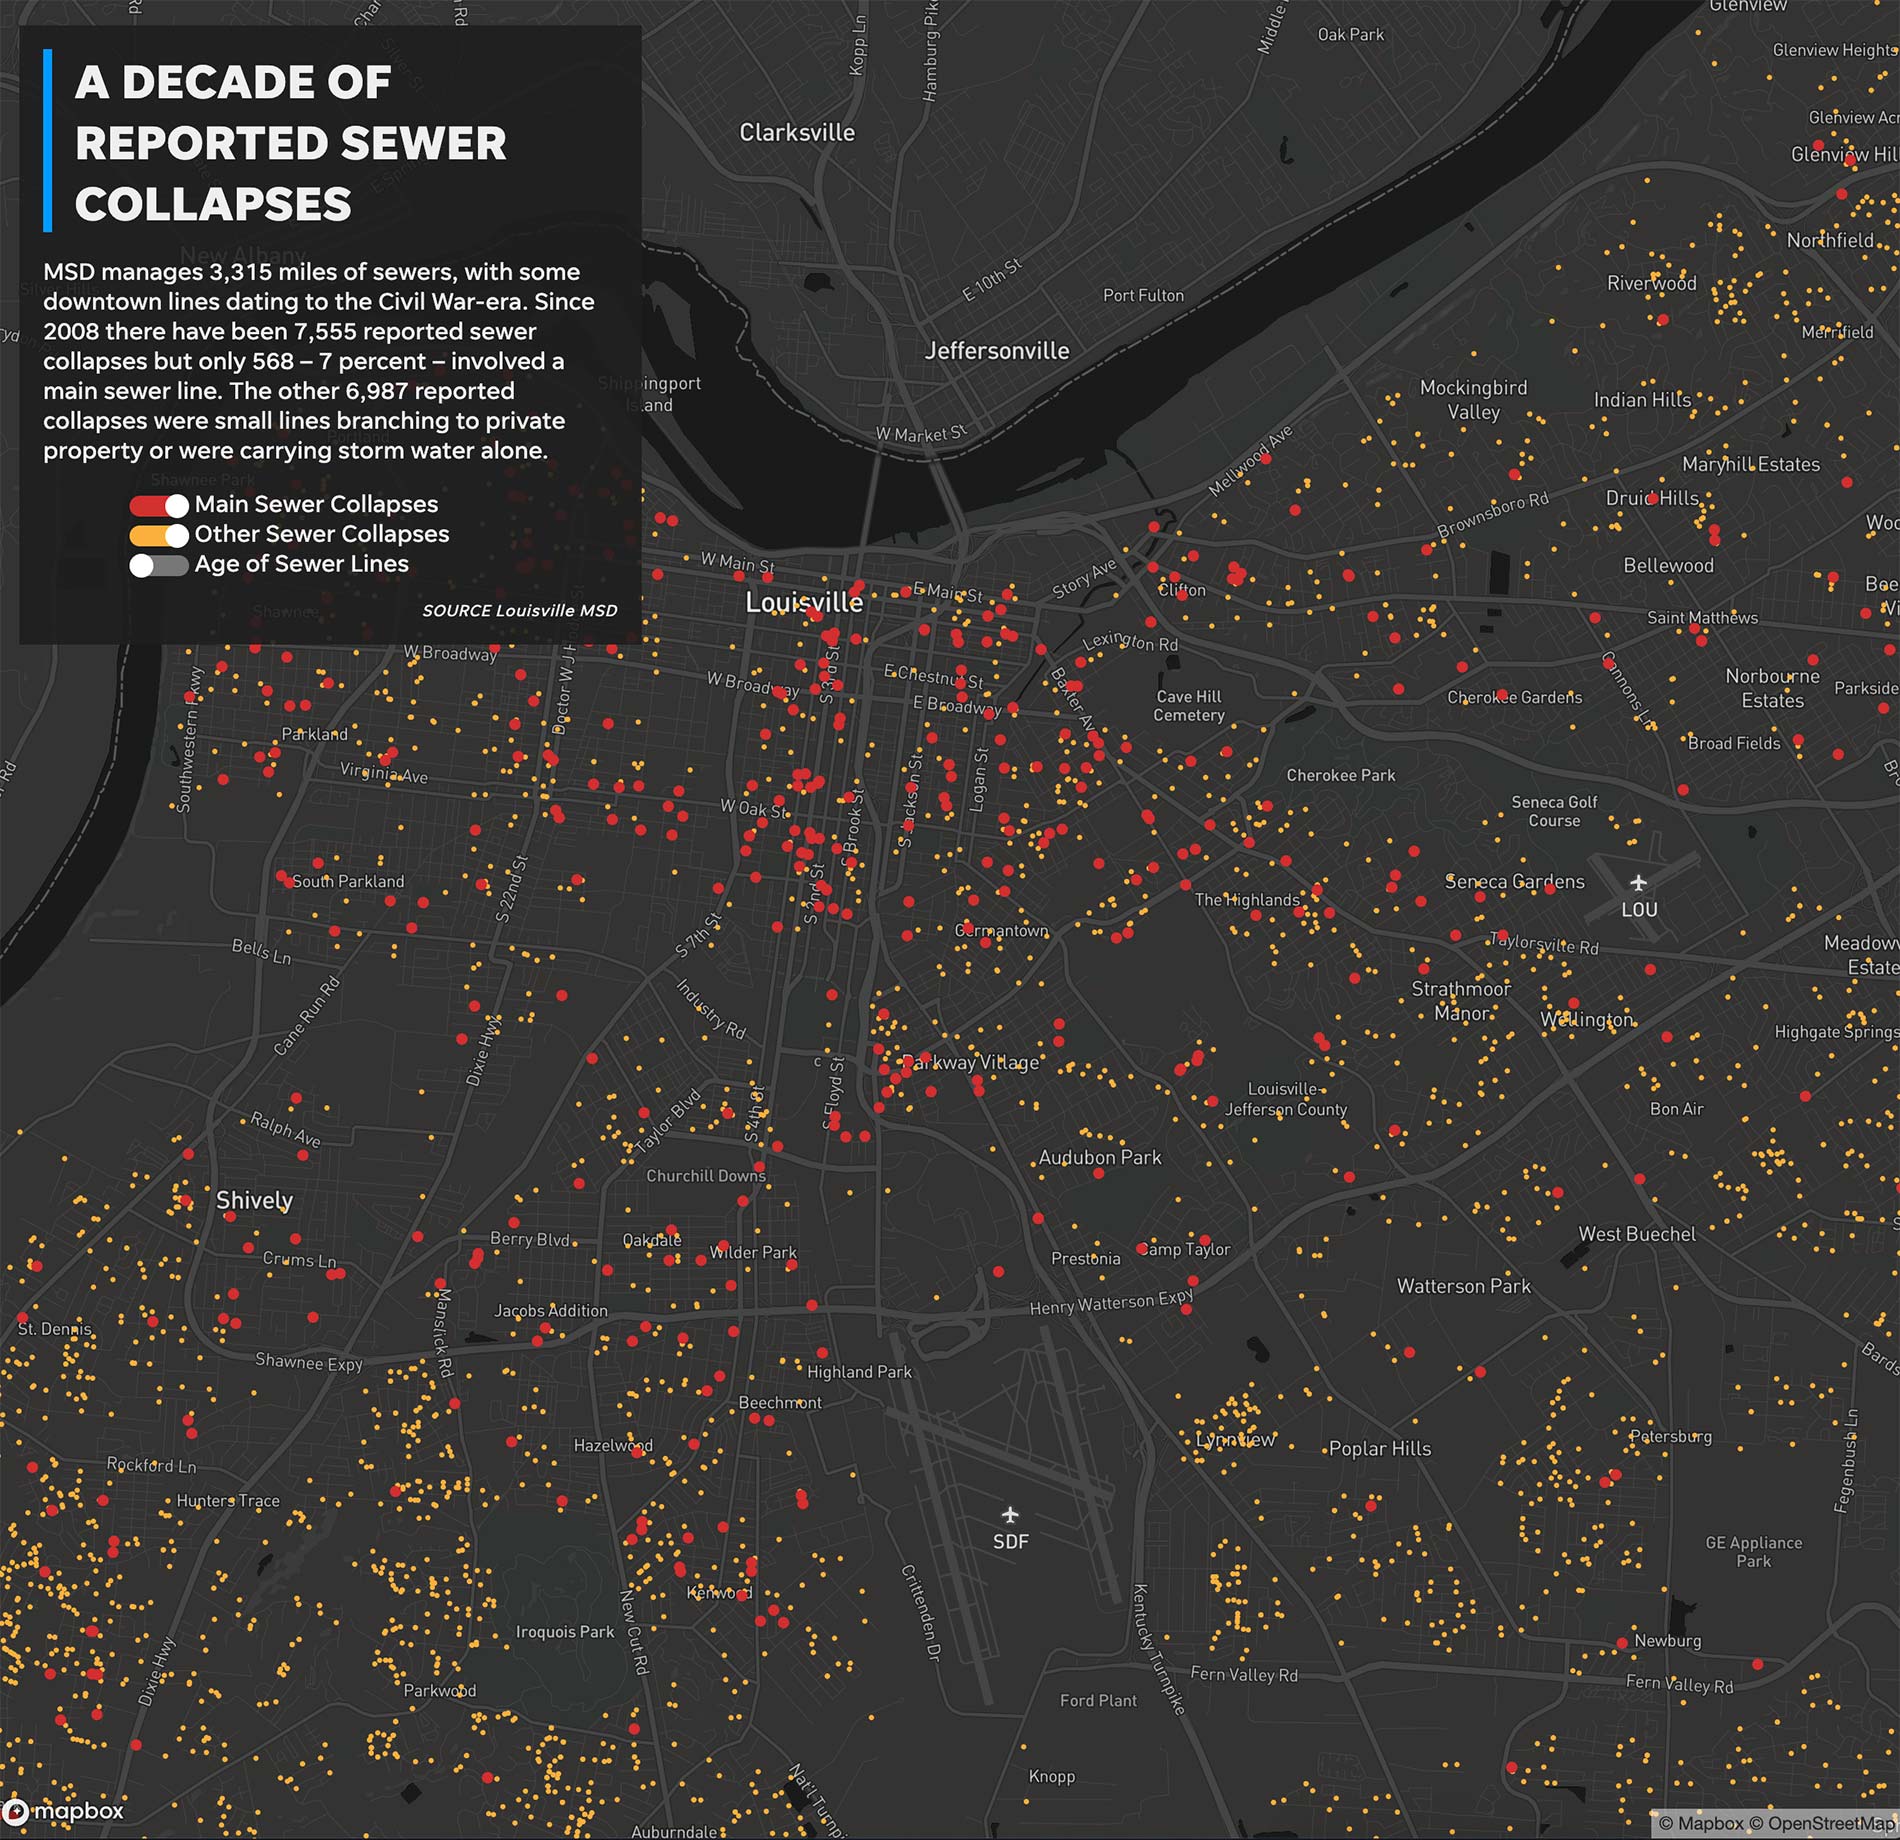
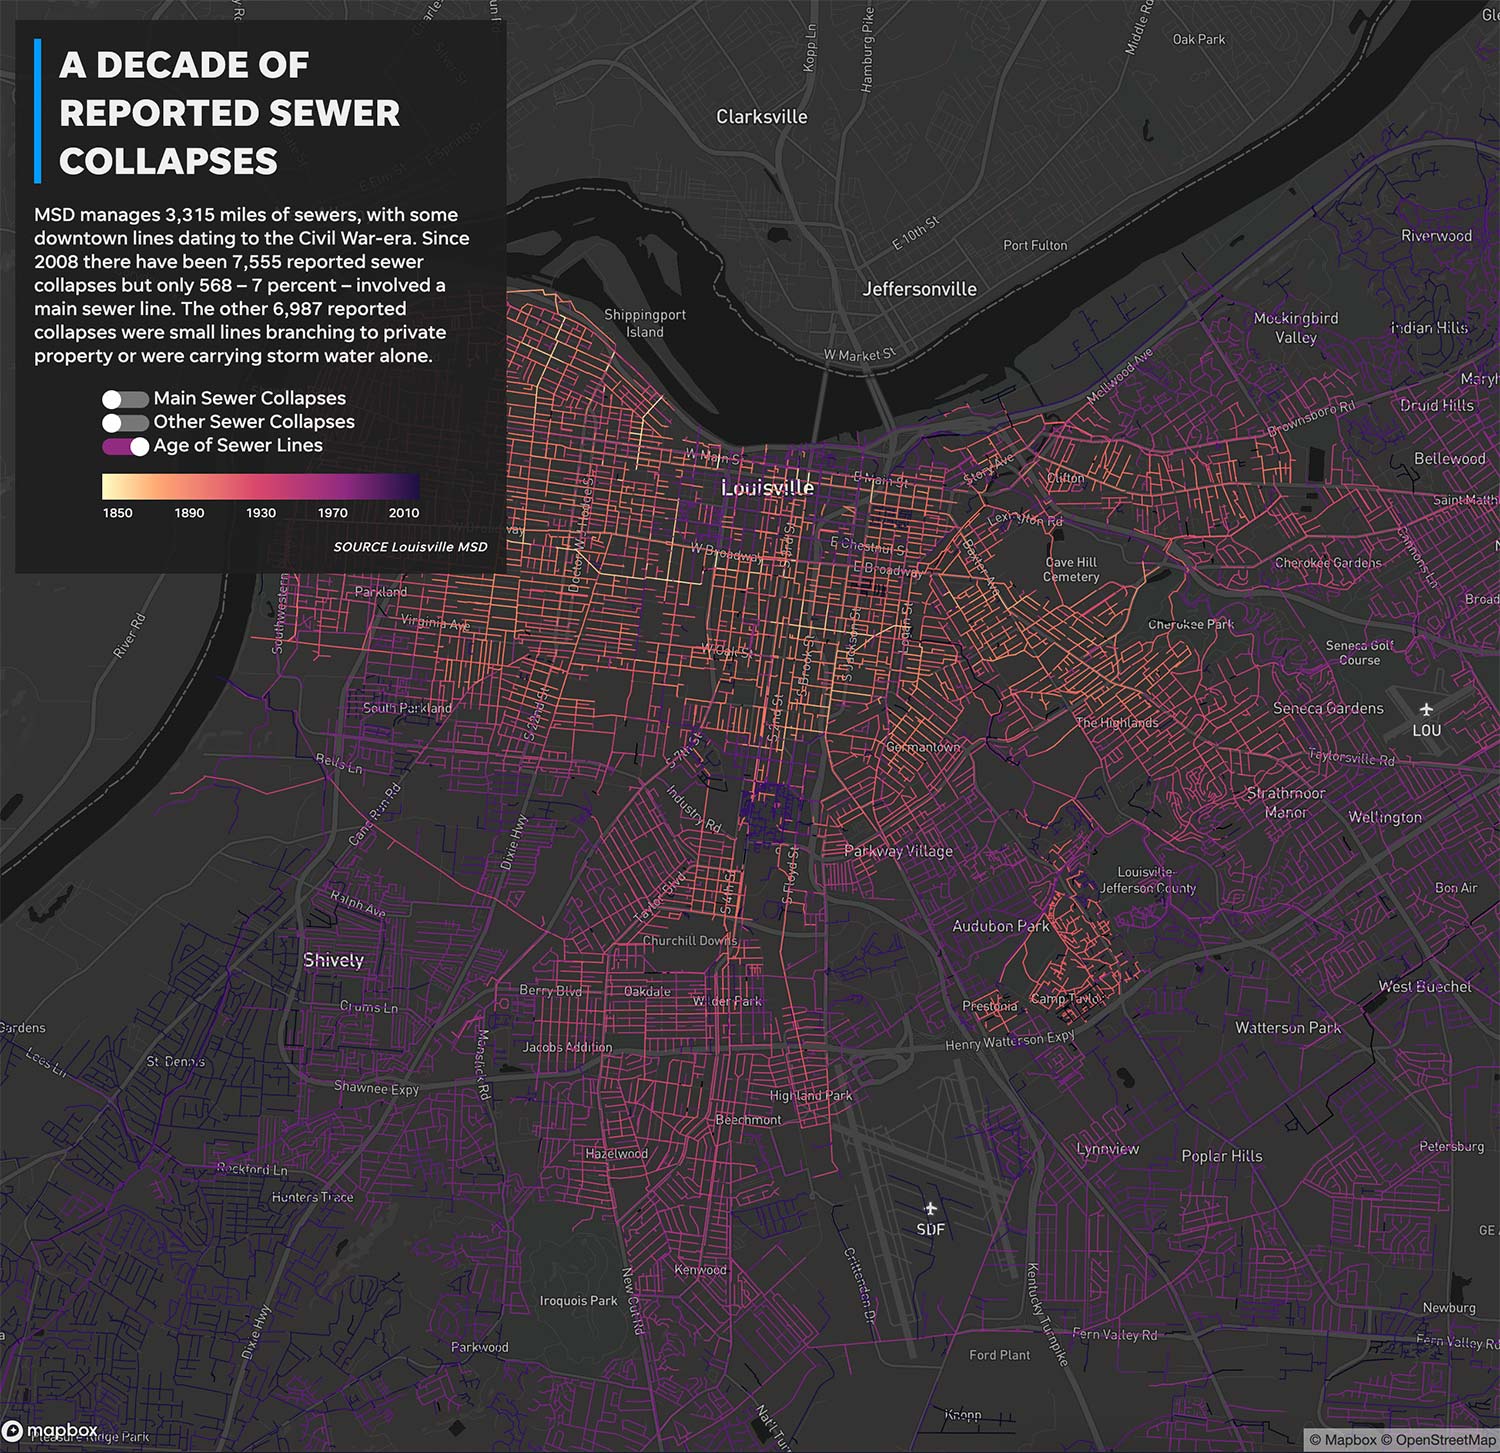
We requested data from Metroplitan Sewer District and mapped it in an attempt to show just how and where sewer collapses were happing in the city. I also used GIS vector data from LOJIC and combined that with data of the sewer lines ages to build the heat overlay.